Post by Aditi Parekh, Assessment Designer and Researcher
The Beyond Dashboards team has been abuzz for the last few weeks! But first, a little story to show us why we call ourselves that. We started by asking, what kind of a teacher-facing dashboard do we want to build to communicate insights from Shadowspect? Until, someone flipped the question to ask — What if it’s more than just a dashboard we want to build? In the spirit of keeping possibilities open, thus came about our new name for this project, Beyond Dashboards! (This was also the rationale for naming Beyond Rubrics, our set of non-digital tools to assess learning in makerspaces.)
We wanted to share what we’ve been up to in this initial phase of collective imagining. We started with some good ol’ literature review that confirms why this project should exist; drew up a list of metrics that can tell us interesting things about student learning; and brainstormed criteria that we’d like to design around. Let’s dive into each of these journeys!
What does the literature say?
To make the most of data-intensive environments such as game-based assessments, reporting tools are crucial interfaces of communication. While dashboards are the most common reporting tools in use, reviews of existing dashboards show that there are multiple gaps: first, in the usefulness of data and information visualized; second, in the perceived impact of peer comparison as the most common mode of presentation; and third, a lack of alignment between learning science design principles and dashboard design. Research on the impact of dashboards in aiding decision making and improving student learning is scarce. Research on older methods of improving teacher assessment literacy paints a different picture: tools such as learning management systems that were never designed with teachers in mind require intensive training in data literacy in order to interpret and use.
Therefore, educators, researchers and designers must ‘meet in the middle’ to create the kinds of tools that can expand the frontiers of how assessment data can be used to make real changes in instructional design and ultimately, in student learning. Successful examples of such a teacher-centered process have been documented in multiple case studies about creating smart glasses for teachers, data-based decision-making tools for early childhood education, and a family of dashboards to improve math instruction in US school districts.
As we evaluated high-level design features of a wide range of existing dashboards – from games, learning management systems, and e-learning platforms – some helpful features stood out: the presence of a wide range of indicators (see a summary of the types below); the ability for a user to select the data being presented; a priority focus on learning-centered insights rather than reports of platform activity; and the use of appropriate visualization techniques.
(For more dashboard-related research, see Bodily & Verbert (2017) “Review of Research on Student-Facing Learning Analytics Dashboards and Educational Recommender Systems”; Jivet et al (2018) “License to Evaluate: Preparing Learning Analytics Dashboards for Educational Practice”; and Sedrakyan et al (2019) “Guiding the choice of learning dashboard visualizations: Linking dashboard design and data visualization concepts”)
Design Criteria
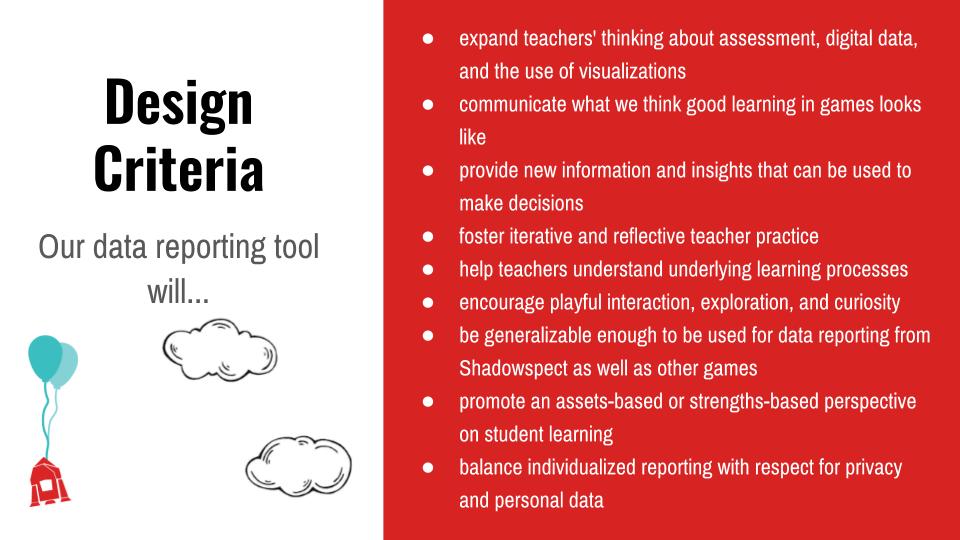
This background research led us to ask — what criteria do we want to design around? As a group of designers, researchers and teachers, we first independently brainstormed and then collaboratively arrived at these design criteria. Our data reporting tool will…
- expand teachers’ thinking about assessment, digital data, and the use of visualizations
- communicate what we think good learning in games looks like
- provide new information and insights that can be used to make decisions
- foster iterative and reflective teacher practice
- help teachers understand underlying learning processes
- encourage playful interaction, exploration, and curiosity
- be generalizable enough to be used for data reporting from Shadowspect as well as other games
- promote an assets-based or strengths-based perspective on student learning
- balance individualized reporting with respect for privacy and personal data
What do we want to measure?
In parallel, our metrics group is asking the all-important question: what do we want to measure? There’s a lot of data we collect from Shadowspect: what shapes were selected, where did they place it, did the student rotate them. Some of this data can be communicated in a straightforward fashion. But a combination of data can be excellent raw material for more interesting metrics! For example: how did the student take different strategies to solve the problem? What sequences of actions indicate misconceptions? To what degree does students’ gameplay indicate mastery of geometry standards?
As an interdisciplinary group of designers, learning scientists and assessment researchers, we brainstormed some metrics that we’d like to see. To give these more definition, we used the following format for each metric:
- Why is this important?
- What is it telling us?
- How might we compute and visualize it?
This process is ongoing and we will soon commence development of the algorithms and data-mining processes to come up with the assessment machinery of Shadowspect.
Takeaways so far
It will be a while before we know that we have been successful, but in thinking about this initial design phase, a couple of practices have seemed helpful:
• Working in interdisciplinary teams: We’ve got a great diversity of skills, experiences and tastes within our team, and it always makes for interesting meetings! By alternating between looking at the problem in our specialized ways and then coming back to converse with others who don’t see it quite the same way has resulted in quite a few of us saying “I hadn’t thought of it that way…”.
• Iteration: We began our design criteria and metrics ideation with individual brainstorming, pooled the insights to see patterns, and then took some deliberate time to build on ideas that weren’t usually ours, lending a new degree of richness to the initial idea.
• Thinking in balance & tradeoffs: Instead of speaking in absolutes, we are exploring how the intersection of our ideas might result in interesting balances and trade-offs between multiple design criteria, most centrally between feasibility/usability and experimentation. In line with our EAGER grant to pursue a “high risk high reward” project, we aim to go high with promoting a sense of exploration and ownership amongst teachers – and perhaps this means that prototypes of our tool will result in trade-offs with other criteria on the list.
We will continue to explore these and other questions further as our development, design and research teams take a shot at giving these criteria and metrics a shape and form!

